My current intraday trading can be found on Forexfactory within the "EU Intraday System" thread started by dsugums:
http://www.forexfactory.com/showthread.php?t=306572
Trading
Wednesday 17 August 2011
Monday 11 July 2011
...short position exit
I have just exited all 4 shorts as follows at 4055 on the break of the 15min 123 reversal, that's enough of a sign to TP on this position, now that all 4 trades are healthy. Lot1: +142, Lot2 +270, Lot3 +375, Lot4 +423. At £10/pip: £12,100.
Thursday 7 July 2011
...short update
...the trades within the short position took a lot of heat last week but now, thankfully the plan is bearing fruit. With this morning's assault on 1.4300 3 out of the 4 trades are now +ve.
Tuesday 28 June 2011
...building a short position
This first chart taken yesterday shows my thinking on the hrly wave structure of yesterday's price action at that point, i was anticipating wave 5 completion and set an order around that level...
...and this morning the corrective abc pattern seems to be unfolding, which tends to suggest we'll see higher prices in the coming sessions, my final short for the position will be at last week's key supply level (the red horizontal line area).
...and this morning the corrective abc pattern seems to be unfolding, which tends to suggest we'll see higher prices in the coming sessions, my final short for the position will be at last week's key supply level (the red horizontal line area).
Thursday 23 June 2011
Supply & Demand...
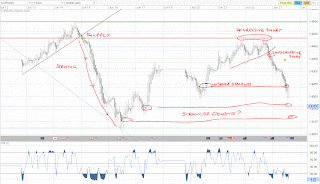
I snipped this earlier today, i missed the break down, the optimal entry being at yesterday's highs if feeling aggressive, but a high probability trade given the strength of the supply level those highs tagged.
....10hrs later and the stronger demand level (1st circle on left) created support once again for the retrace and using the price pivot entry technique there's already been a 100 pip move. Hope to be able to trade the next move like this!
Wednesday 22 June 2011
Trade 3 - short again...
...i entered short last night with an initial stoploss above yesterday's high, just as well with the Asian run up. My reasons for entry included bearish hourly candles from 2 fib levels from higher TF swings and a rejection of the round number (1.4400)...this morning's hrly chart shows a short 123 developing (yet to break) from these levels.
Edit...cut my losses on an hourly close above 1.4400 just now for -54. Blog pip tally now +203.
Tuesday 21 June 2011
Analysis for this week...
Price is once again at a make or break level, you can see how 1.4300 has been the line in the sand for May and June so far. This is an 8hr TF chart, you can see that the previous HA candle closed bullish and that the current candle is bullish so far but look at the RSI, the current swing is weaker than the previous swing, from June 16th lows.
For now bets are off, i'm waiting for the market to show where it wants to go next, a re-test of 1.4500 isn't that far from current price and neither is s re-test of the 1.4070's to tap the round number (1.4000)....time will tell and time to be patient, again :)
Subscribe to:
Posts (Atom)


